The electricity we use creates different levels of CO2 emissions at different times of the day and night. This depends on how much regionally and regeneratively produced electricity is actually flowing in the grid and how high city-wide consumption is.
For example, if the grid is currently being supplied with a lot of wind energy from northern Germany, solar energy from the south or energy produced by individual households, the current, real CO2 emissions will decrease. Wuppertal’s public utilities have been calculating the actual hourly CO2 emissions behind the electricity we consume for several years.
In collaboration with the Bergische University and the Arrenberg Climate District, these were transferred to grids and the “energy weather” concept was developed and made visible. It divides CO2 emissions into three levels and shows them in red, yellow and green to indicate whether they are currently high or low and how they are likely to evolve in the coming hours and days.
So you can reschedule your usage instead of cutting down. Use existing devices instead of always buying new ones. These are ways in which every household can contribute to the energy transition and climate protection, regardless of financial resources. It won’t solve all our problems, but it’s a smart step that everyone can take.
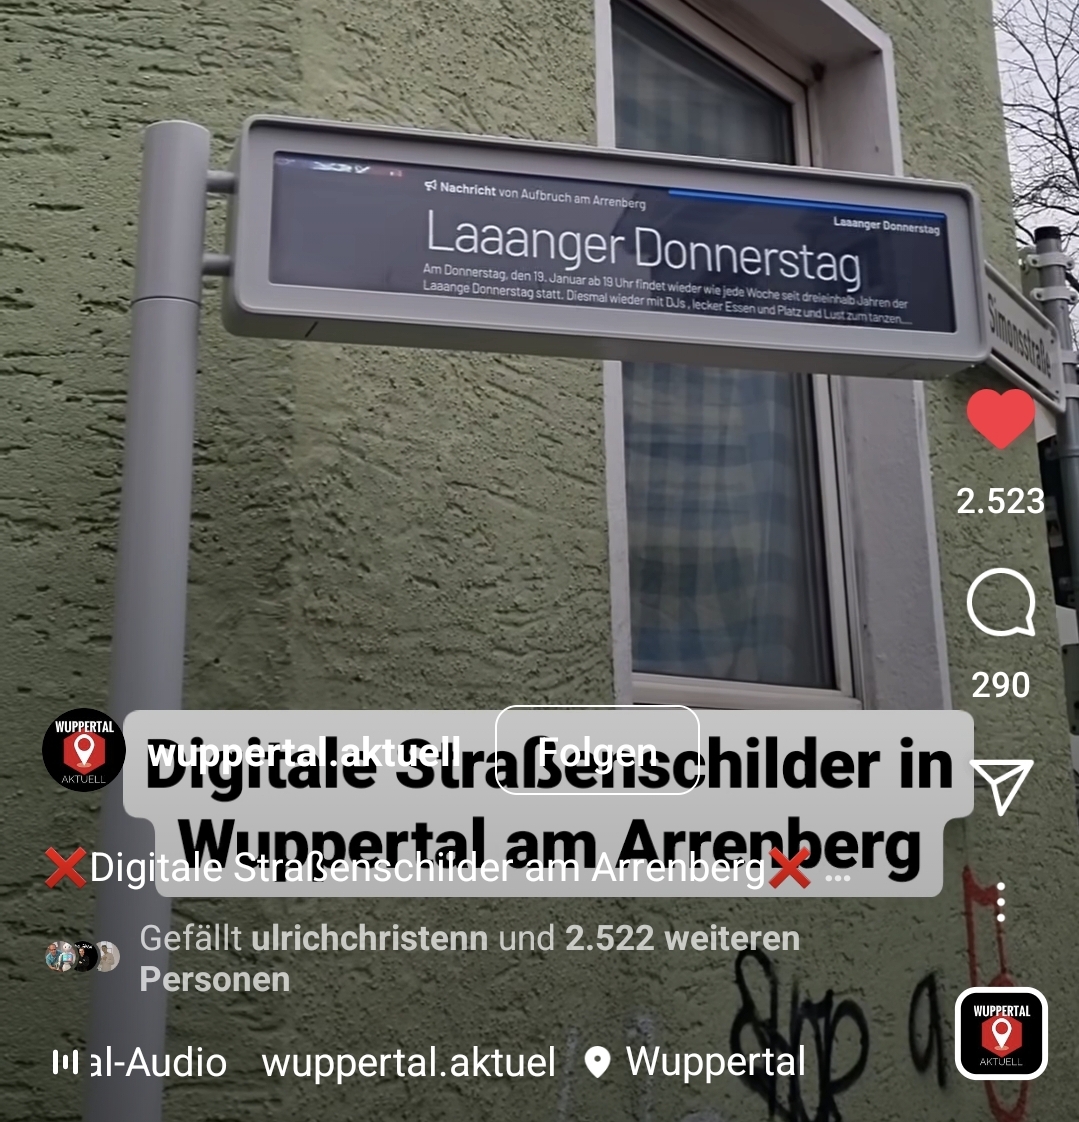
Der Insta-Kanal @wuppertalaktuell hat in seiner Instastory ein kurzes Video über die digitalen Straßenschilder am Arrenberg veröffentlicht.
Das Real-Video wurde fast 90.000mal angesehen und kräftig kommentiert. Mehr als 2.500 User haben dem Video ein Herz gegeben. Aber auch einige Hundert haben in ihren Kommentaren die Displays kritisiert und ihren Ärger Luft gemacht. Meist ging es um Steuerverschwendung oder dass man den Straßennamen wegen der Werbung nicht sehen könne. Wofür die Displays eigentlich sind und dass hier kein Steuergeld verbaut wurde, haben da wohl die wenigsten gelesen.
Danke, @WuppeetalAktuell für die Reichweite.